Infrastructure Monitoring Solutions
Let Us Handle Your Infrastructure Challenges While You Focus On Your Business
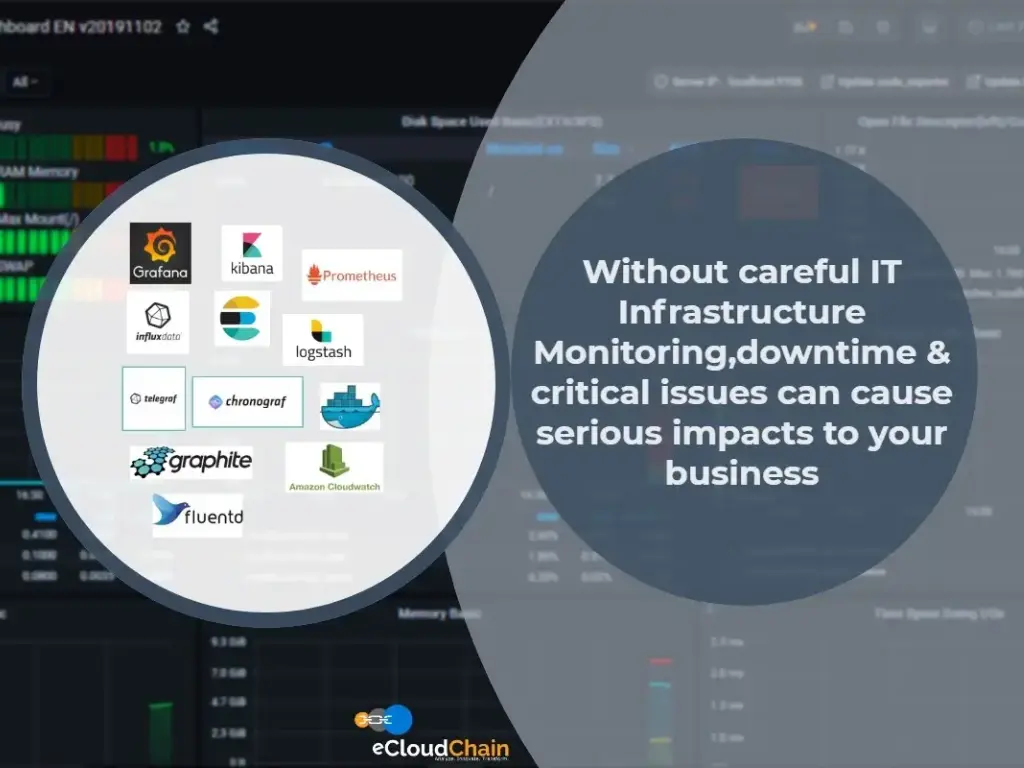
In today’s digital landscape, effective infrastructure monitoring is crucial for organizations to ensure optimal performance, uptime, and resource utilization.
Without continuous monitoring and timely alerts on performance and latency issues, businesses risk significant cost leakage from outdated siloed infrastructures.
By adopting a comprehensive monitoring strategy, companies can avoid disruptions, enhance operational efficiency, and safeguard their bottom line against unforeseen challenges.
Partner With Us For Infrastructure Solutions That Transform Complexity Into Simplicity
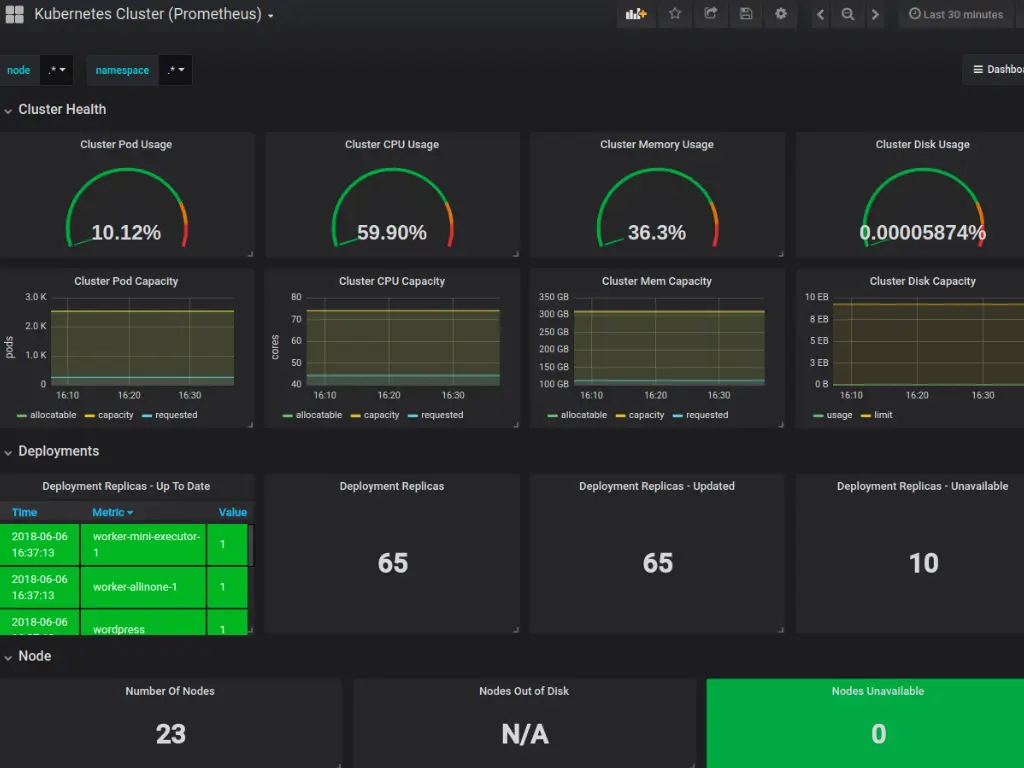
With extensive experience in infrastructure monitoring across Kubernetes,Docker, Terraform, Ansible for Cloud and On-premises environments, we ensure continuous monitoring and health checks for your applications.
Our team analyzes logs, metrics, and traces to provide timely alerts based on predefined thresholds, helping you maintain optimal performance, uptime, and latency.
We leverage modern monitoring tools like Grafana, Prometheus, Elasticsearch, Logstash, Kibana, Apache Superset,Amazon QuickSight and more to deliver cost-effective resource management and address your critical challenges effectively.
Build Automation
Identify the areas of automation.Infrastructure Monitoring helps you with the right information where automation can be build
Alerts & Notifications
Get the real-time alerts & notifications on the critical events.Have a better IT governance with Infrastructure Monitoring in place
Quick Troubleshooting
Quickly troubleshoot the bottlenecks causing the technical issues and minimize the overall resolution time and improve up-time
Avoid Overspending
Track the infrastructure resources to effectively manage IT spending
Minimize Downtime
Avoid panic shutdowns of your IT systems.Plan & minimize downtime
Build Security
Monitor all the IT access controls and avoid any possible security violation
Predictive Maintenance
Anticipate critical IT issues in advance and prepare and early solution
Customize Infrastructure Monitoring Solutions for Your Business Needs
Explore, Analyze, and Visualize All Your Log Matrix
Your Business requirements change rapidly and can’t fit into a single product offering. Get a comprehensive long term monitoring solution that is customizable only for your needs and can be used as all your monitoring needs.
Highly Flexible
Constantly keep improving the solution to your needs without waiting period from the product vendors
No Product Lock-in
Get a complete solution only for your core business instead of a generic product developed for all the industries
Highly Customizable
Add new use-cases, integrate with other new technologies as per the business requirements
Cost-Effective
Pay low software license fees and hardware costs. Only pay for what you use with the power of cloud-based pay-as-you-go model
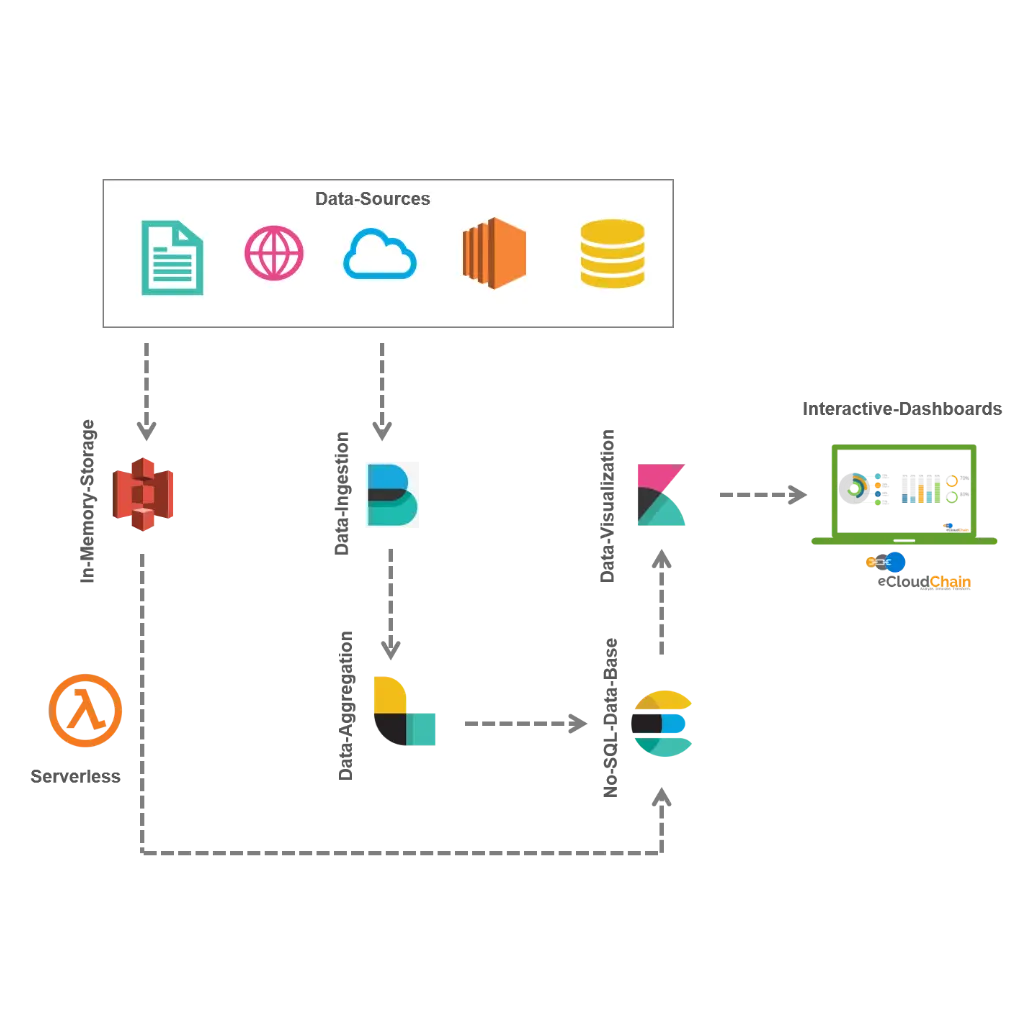
Infrastructure Monitoring Solution -with ELK Stack
Elasticsearch-Logstash-Kibana(ELK) stack is the world’s most popular log management platform and it’s proven to be the most robust log analysis solution across the industries. Elasticsearch is a No-SQL database for full-text search based on Apache-Lucene search engine, while Kibana is the visualization software and Logstash is the log aggregator.
Our infrastructure monitoring solution is based on the ELK stack deployed on AWS Cloud on the EC2 instance. Our data analysis engine performs aggregations in real-time on the data logs ingested by Logstash from different data sources. The solution also uses serverless technology for the data-lake integration build on AWS S3 for external logs,data-sources, and IoT data.
Monitor Your Data Logs & Metrics
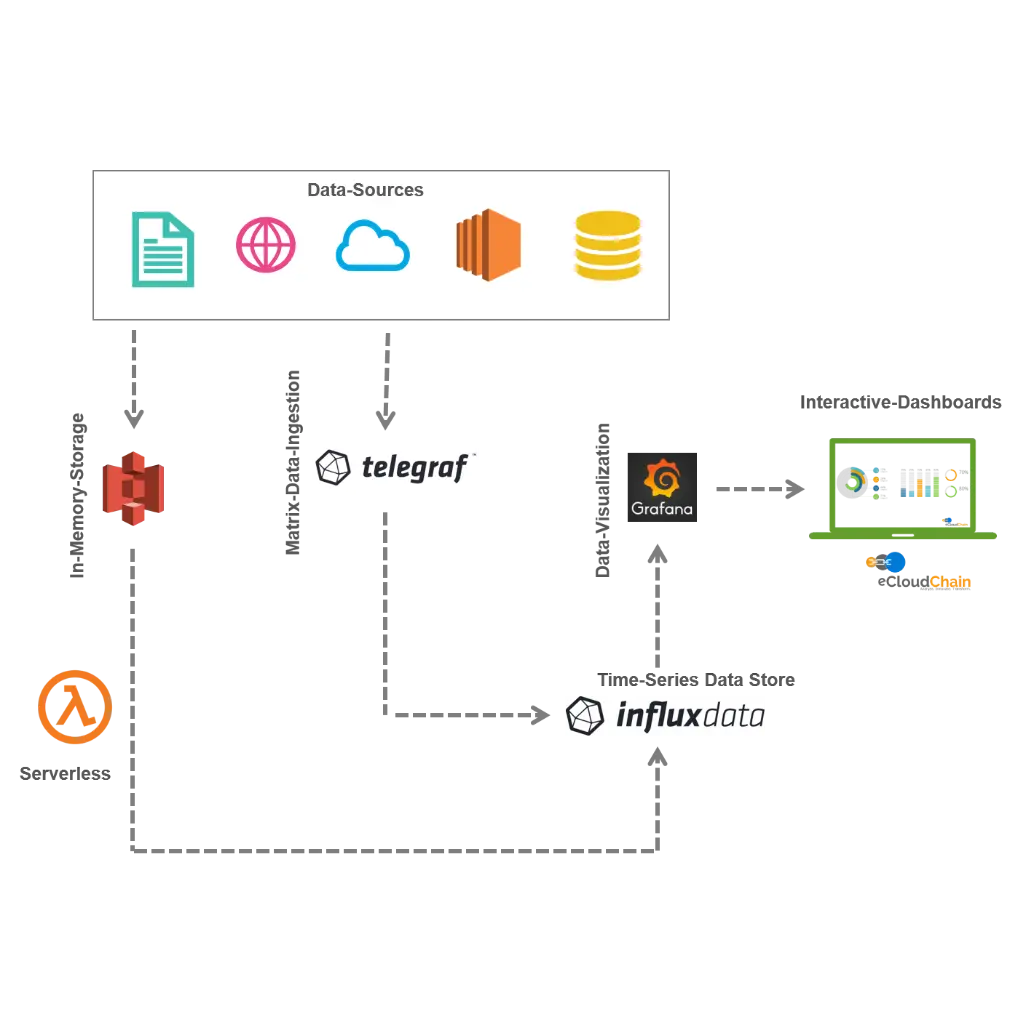
- with TIG Stack
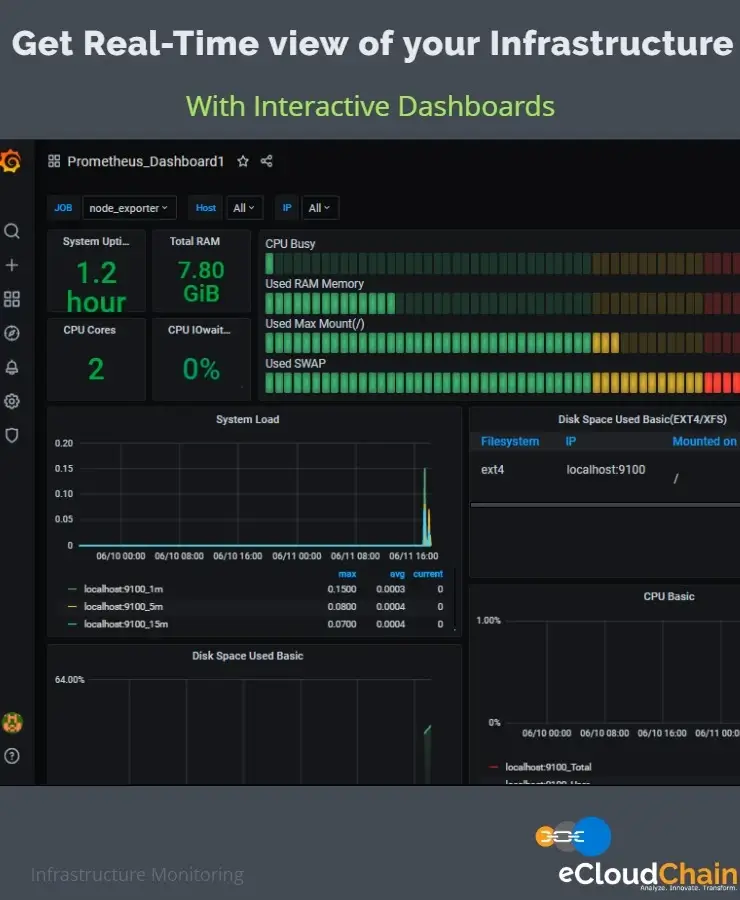
TIG(Telegraf–InfluxDB–Grafana) is an open-source stack that is designed to handle high query loads. Telegraf is a plugin driven server agent for collecting metrics from databases, systems, and IoT sensors.InfluxDB is a time-series database designed to handle high write and query loads, and Grafana is opensource visualization and analytical software.
Our cloud-based infrastructure monitoring solution is based on the TIG stack deployed on AWS Cloud on the EC2 instance. Telegraf integrates with all your data-sources for metrics and logs collection and ingests it into InfluxDB.After the necessary analysis of the data-sets, the visualizations are created on Grafana to build continuous monitoring.
Achieve Performance At Scale
Enabling Digital Transformation With Cloud MSP
Give Your Business A Strong Security Posture With Our Cloud Offerings.
Use-Cases
Infrastructure Monitoring
Get all your infrastructure metrics/logs into one single view
Application Monitoring
Monitor your applications in real-time and discover areas of improvements
Cloud Monitoring
Manage your cloud services more effectively with cloud monitoring
Container Monitoring
Increase the effectiveness of your micro services architecture
IoT Analytics
Monitor the real-time data-streaming generated by IoT devices
Cost Monitoring
Monitor cost and configure alerts on reaching certain threshold